⏰ Old Post
This post is over 17 years old - it might be slightly outdated and consigned to the history books.
Website speed is a key to a successful website, no one likes a website that is slow, peoples interest drops by the microsecond the longer they have to watch the browsers loading animation spin around.
BuiltWith.com response time for pre-cached sites was taking around 2 seconds to load the page, double that and add some for sites that were not cached. Non-cached sites are out of BuiltWith’s hands as we rely on the response time of the site being queried to come back with data.
However the 2 seconds and sometimes over 4 seconds wait for a pre-cached page was unacceptable.
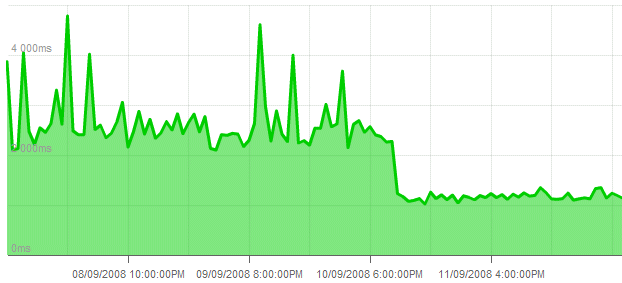
BuiltWith used the services from pingdom.com to monitor response times for cached pages at builtwith.com over a one month period. The results for the previous few days are shown below -
As you can see from the chart above, a drop in response time is shown from an average of 3000ms to 1000ms is shown between 10/09 and 11/09.
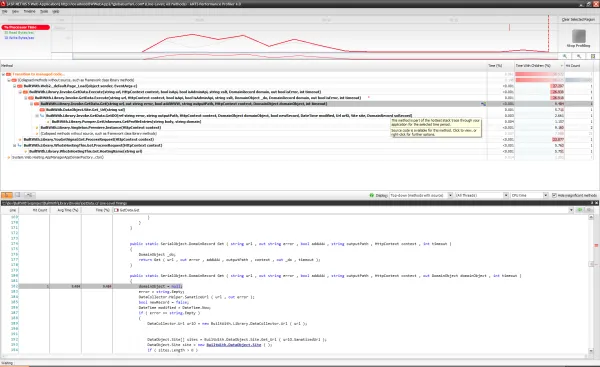
BuiltWith is written is ASP.NET (see here) using the Red Gate Ants Profiler 4 code profiling tool we were able to identify the speed bumps in the code and remove them or optimize the code.

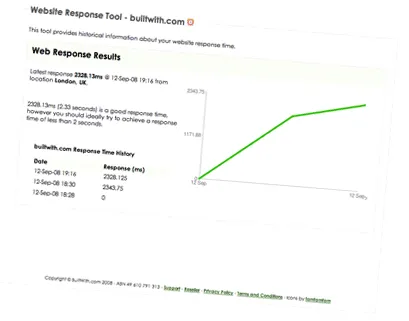
These two tools, Pingdom and Ants Profiler proved crucial to our analysis and fixing of response time issues on BuiltWith.com. Pro Users of the BuiltWith Website Optimizer are also provided with response analysis tools which track a history of website responses, one of the many features of the Pro service.


